Are electric cars really that sustainable?


Short summary:
As low-carbon sources of energy (nuclear and renewables) become readily available, the world needs to rapidly transition away from fossil fuels.
Our calculation of the carbon footprint of a petrol car was based on fuel emissions from driving (an average of 52 km/day) and on the emissions from oil production (well-to-refinery).
The carbon footprint of an electric car is intrinsically connected to the source of electricity used to power it - its indirect CO2 emissions greatly depend on the country/state you charge your car. Considering the average electricity mix used in the U.S.A. and a total of 8.2 years/160000 km (time of battery warranties) an electric car with batteries between 100 kwh-30 kwh would produce less 37%-52% emissions than a petrol car.
We concluded that before deciding to buy an electric car you should check the percentage of low carbon sources (renewables+ nuclear) in your country/state. Except for a few cases (in which the electricity is provided by >70% from coal) buying an electric instead of a petrol car is a better option for the environment! :)
For more detailed information we ask you to read the full blog post.
Air pollution caused by the transportation sector
The transport sector is responsible for 21% of global pollutant emissions and is a major contributor to local air pollution. In cities with a lot of traffic, greenhouse gases emissions from transport can go up to 45%. In 2017, outdoor air pollution was responsible for an estimated 3.41 million deaths globally.
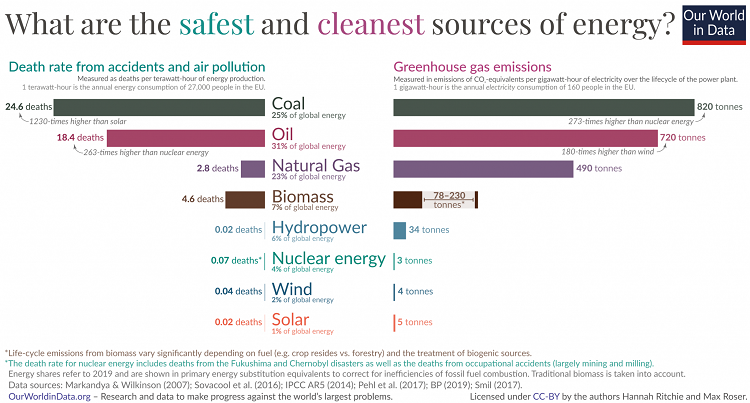
Image 1. Graph showing the number of deaths per terawatt hour of energy production (on the left side) and the emission on CO2-equivalents per gigawatt-hour of energy production (on the right side). Source: Our World in Data.
As low-carbon sources of energy (nuclear and renewables) become readily available, the world needs to rapidly transition away from fossil fuels.
Personal comment
The motivation to write about this topic came when I realize that from all the 22 actions included in our Changeit app that help people reducing their individual’s footprint, the single action with the highest carbon footprint is private car journeys. By committing to “Less car journeys“, people can significantly reduce their carbon footprint!
In addition to reducing our dependency on private cars, I wondered how much CO2 can you actually save by choosing an electric car instead of a petrol car.
During my research on this topic, I learn many new and interesting things which I am going to share here.
Come with me through a wonderful journey of batteries, oil and electric facts (see what I did there?)…
Efficiency – petrol vs electricity
I was really surprised to find out how inefficient is petrol combustion. During the process of petrol combustion, only 30% is actually used for moving the car while the other 70% is lost in heat (chapter 8.3.2)!
In an electric car, around 80% of the energy consumed is used for the car to move - only a small percentage may be lost when charging (chapter 8.3.2 of this report). Moreover, electric cars are embodied with a system called regenerative braking in which every time you brake, energy is being absorbed and can be used later. Regenerative braking helps in extending the range of the electric vehicle by 8-25%. Apart from saving energy and enhancing the range, it also helps in effective control of the braking operation.
CO2 footprint – petrol vs electric car
- CO2 footprint of a petrol car
The average-size petrol car emits around 196 g of CO2/km. By driving an average of 52 km/day a petrol car produces 306 kg CO2 per month.
Emissions from extracting crude oil from the ground, moving the oil to a refinery and making gasoline were calculated to be around 10.3 g CO2 per megajoule (MJ) of crude. (1MJ equals 0.0292 L of gasoline).
Considering a car uses on average 98 L a month (52 km a day, consumption 6L/100km), this means well-to-refinery and oil production emissions correspond to 34 kg of CO2/month.
Therefore a petrol car consumes 340 kg of CO2/month (306 kg of fuel driving +34 kg of gasoline production) (see Image 3).
Emissions from transporting gasoline from refineries to petrol stations are not included in this blog post.
Side note: Diesel cars will not be used for comparison in this post. Diesel cars emit less CO2/km but governments realized, later on, that diesel cars are not a good alternative to petrol cars, as they produce much higher levels of oxides of nitrogen (NOx) a chemical compound that’s hazardous to air quality and human health. Inhalation of nitrogen oxide species increases the risk of lung and colorectal cancer.
- CO2 footprint of an electric car (EV)
To accurately calculate the footprint of an EV one has to take into consideration both the footprint of producing the electricity that powers the vehicle and the emissions released during the production of the EV’s battery.
The carbon footprint of an electric car is intrinsically connected to the source of electricity used to power it - its indirect CO2 emissions greatly depend on the country/state you charge your car.
Electricity mix is the combination of different resources (coal, oil, gas, nuclear and renewables) that are used to supply energy to each country/state (see Image 2.).
Before deciding if you should buy an electric car you should check the percentage of low carbon sources (renewables+ nuclear) in your country/state. You can see how is the percentage of renewables energy (solar, wind, biofuel, hydropower) of each country using this map, and the percentage of total low carbon sources (renewables+ nuclear) using this map.
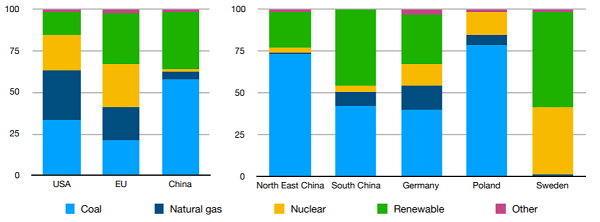
Image 2. Bar graphs showing the average energy mix of USA, EU and China (Graph on the left) and the average energy mix of North East / South China, Germany, Poland and Sweden (Graph on the right). High carbon: Coal and natural gas. Low carbon sources: Nuclear and Renewables (solar, wind, biofuel, hydropower). Source: Analysis of the climate impact of lithium-ion batteries and how to measure it. July 2019.
Coal combustion is the most polluting fossil fuel followed by oil, and then natural gas emitting around half of coal emissions’ - but still very pollutant! (see Image 1).
On a positive note, the percentage of global electricity produced from renewable sources is increasing every year!
CO2 footprint of electricity production
To check the electricity mix of each state in the USA and how much CO2 an electric car would emit per mile I used this website. To do the calculations I compared the American state that has the highest percentage of carbon polluted sources (West Virginia- 89% coal + 5% gas), to the one with the lowest percentage (Idaho- 20% fossil fuels) and to the average mix of the USA and Europe.
Therefore, because the electricity mix from West Virginia is the most pollutant then the emissions of CO2 per month (driving an average of 52 km a day), is nearly as high as using a petrol car.
However, in Idaho state where the percentage of electricity sources from gas and coal is only 20% combined, and 80% comes from renewables and nuclear energy, the carbon footprint drops by more than 10-fold (400 kg vs 36 kg of CO2 per month)! (See Image 3).
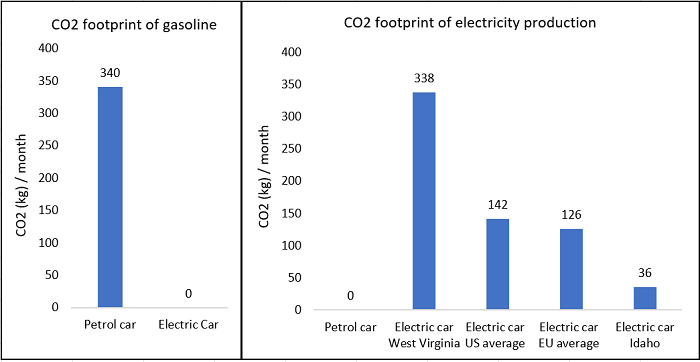
Image 3. Bar graphs showing the emission of CO2 per month considering travels of 52 km/day. Left graph- CO2 emissions of an average petrol car including emissions from gasoline combustion + gasoline production - emissions from extracting crude oil from the ground, moving the oil to a refinery and making gasoline. Right graph – CO2 resulting from electricity production considering different mixes. West Virgina using 89% coal + 5% gas, USA average using 60% fossil fuels (20 % coal+40 % natural gas) and 40% low carbon (renewables +nuclear). Idaho state using 80% low carbon. For Europe, the values for Kansas were used as it corresponds to 36 % fossil fuels + 64% low carbon (similar to EU - 40% fossil fuels + 60% low carbon). Source: Changeit.
Using the average mix electricity supply of USA/Europe, driving an electric car releases 2.1x/2.4x less CO2 emissions than driving a petrol car. Considering an average of 52 km a day, one would reduce 198 kg of CO2/month in USA or 214 kg of CO2/month in Europe!
CO2 footprint of battery production
Electric cars are moved by lithium batteries and their production entails high CO2 emissions. One of the reasons for this high carbon footprint is that nowadays the batteries are made in countries where the mix of energy is not so clean (such as China that produces 60% of its electricity from coal). If the batteries are made in Europe (and there are proposals on the way for that to happen) then the carbon footprint of the batteries will reduce.
The CO2 footprint from producing a car varies depending on many factors, being one of them the size of the car (for example, production of a Citroen C1 emits 6.000 kg of CO2 while a Land Rover Discovery emits 35.000 kg of CO2). The main difference between petrol and electric cars is the additional cost of the lithium batteries used in hybrids and electric cars. The emission for disposal is also similar between both types of cars so those numbers will not be used for comparison. Therefore, only the battery of the electric car will be used to compare the differences in CO2 emissions between petrol and electric cars.
A comprehensive study calculated the cost of lithium batteries to be around 73 kg CO2-equivalent/kWh.
The production of batteries of three common range: 30 kWh, 40 kWh (e.g. Nissan leaf) and 100 kWh (e.g. Tesla) emit:
- 30,2 kWh * 73 kg CO2/kWh = 2205 kg CO2 - per life time of 160000 km / 8 years = 13.7g/km
- 40 kWh * 73 kg CO2/kWh = 2920 kg CO2 - per life time of 160000 km/ 8 years = 18.25g/km
- 100 kWh * 73 kg CO2/kWh =7300 kg CO2 - per life time of 160000 km / 8 years= 45.6g/km
The CO2 footprint of the batteries per month (driving an average of 52 km per day) is:
- 30,2 kwh battery - 13.7 g/km * 1560 km = 21.4 kg CO2/month
- 40 kwh battery - 18.25 g/km * 1560 km = 28.5 kg CO2/month
- 100 kwh battery - 45.6 g/km * 1560 km = 71.1 kg CO2/month
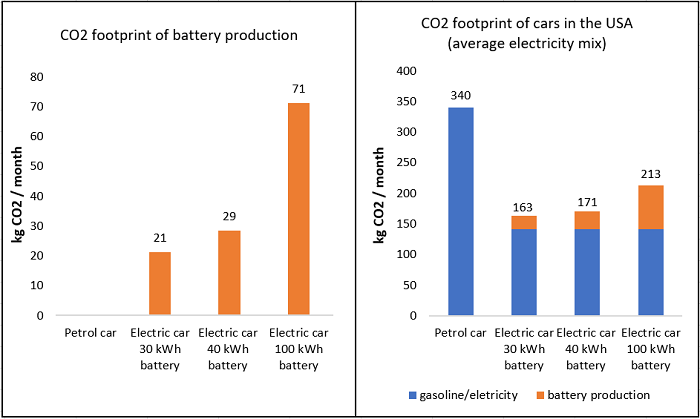
Image 4. Bar graphs – Monthly emissions of CO2-equivalents of three different battery ranges (30, 40 and 100 kWh), considering 8 years of lifetime of a battery or 160.000 km (graph on the left). Emissions of CO2-equivalents of an average petrol car (Blue – monthly emissions produced from gasoline combustion + gasoline production - emissions from extracting crude oil from the ground, moving the oil to a refinery and making gasoline) and three electric cars with different batteries range (30, 40 and 100 kWh). Blue – monthly emissions produced by electricity mix of EU average. Orange – monthly emissions of CO2-equivalents of three different batteries considering 8 years of lifetime of a battery. (graph on the right) Source: Changeit.
Considering the average electricity mix used in U.S.A and a total of 8.2 years or 160000 km (time of battery warranties) an electric car with batteries between 100 kWh-30 kWh would produce 1.5-2.1 tonnes of CO2 less per year (127 kg-177 kg CO2/month). That is less 37%-52% emissions than a petrol car!
These numbers can easily go up to 60-83% reduction in CO2 in countries/states where around 80% of the mix electricity comes from low carbon sources (renewables+nuclear)!
Moreover, these days, in many countries, especially in Europe, it isn’t hard to find an energy supplier that can provide 100% green electricity. If people charge their car at home from 100% green electricity providers the emissions from driving the electric car will reduce even more!
Comment about hybrids: Plug-in Hybrid cars are powered by both a combustion engine and also a small range electric battery (<30 kWh) which depending on the car corresponds to a range of 20 km-50 km (chapter 8.3.2). If you drive more than that limit you will be emitting greenhouse gases because the combustion engine starts working. If you accelerate a lot, the combustion engine will also start working along with the electric supply. In line with the sustainable goal of the Paris Agreement, hybrids would not be a good enough solution. Having that said, if you use the petrol option very rarely it is, of course, a better option to buy a Hybrid comparing to buying a normal petrol car.
Conclusion
Except for a few cases (in which the electricity is provided by >70% from coal) buying an electric instead of a petrol car is a better option, environmentally speaking.
Furthermore, keep in mind that if you buy an electric car today, savings of CO2 emissions will likely increase over the years, as more and more infrastructures of wind and solar panels are being installed and coal plants are being shut down!
I know it might seem challenging to switch to a different type of car, with no sound and no gear but don´t let that get in the way of your sustainability goals! You can make the change! Let´s change it!
As electric cars can be a complex topic I decided to do a series of 3 blog posts in order to cover different aspects. If you want to know more about the environmental impact of lithium batteries or just how expensive electric cars are or how convenient is exactly the charging process, stay tuned for Part II and Part III, next week!
Climate Change App
If you want to start living a more sustainable life, our app - Changeit - gives you simple actions you can start taking now to reduce your CO2 footprint. We designed our app to help busy people that want to fight climate change.
We compiled all the information in easy-to-read actions and notifications that will help you adopt more sustainable behaviors without taking much of your time.
Start changing your habits today!
Written by : Carolina Freitas (PhD)
Linkedin profile
